Recovering hidden capacity, preparing for rate increases
A complete plant performance study with discrete-event simulation, built in full and shown end to end. It takes a full fabrication area, dedicated machine pools and offline rework included, from constraint diagnosis through four sequenced recovery moves to a validated rate path.
Representative case study based on real production work. Identifying details and selected inputs have been adjusted.
00 · The answer
Problem. The area misses its current commitment despite recurring overtime. A rate increase is approaching.
Constraint. The area has one governing constraint at a time, but it does not stay in one place. It begins at Op 10, moves to Op 40 after the first recovery move, and then reaches Op 30's type-specific capacity and flow. Repeat quality load is the final barrier to meeting demand at straight time. The simulation reveals that sequence before the floor commits.
Result. Current demand is met at straight time. Under the same overtime allowance, the operating ceiling rises 46 percent, from about 80 to about 117 parts per day. About $1.1M in annual waste is removed. A separate lean second shift carries the area to about 157 parts per day as demand rises.
Method. Four sequenced moves. No new production equipment or added headcount in the recovery. Each move addresses the current constraint and anticipates the next.
01 · The problem
Missing demand while paying overtime
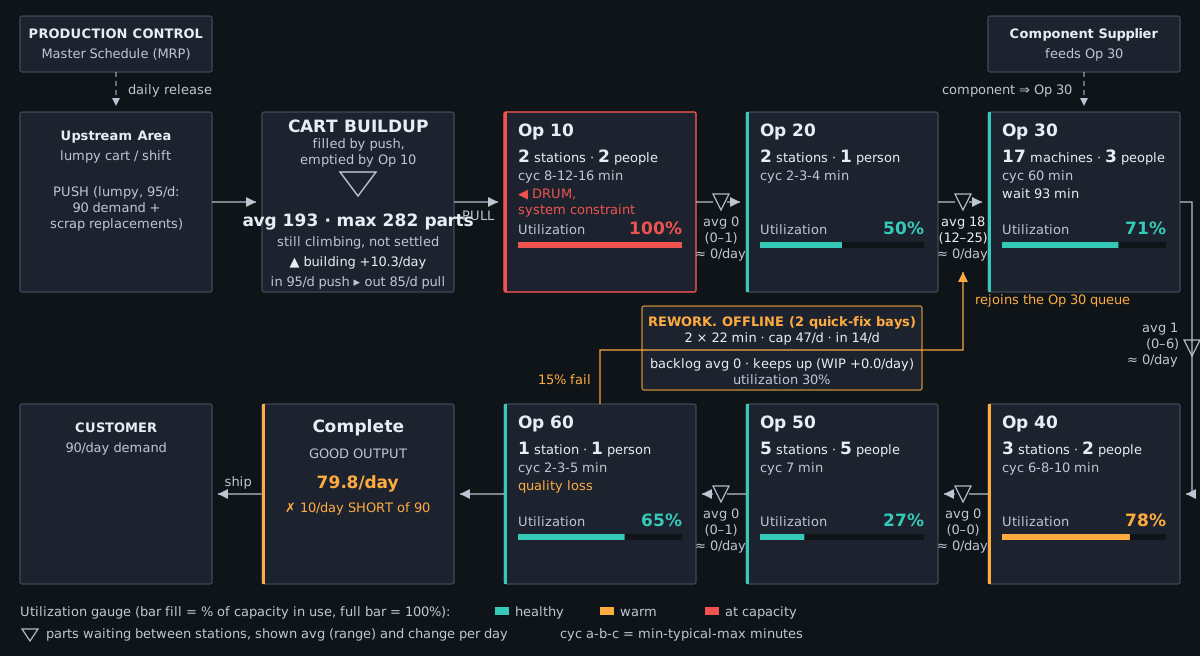
The area commits to 90 parts a day and ships about 80, missing roughly 11 percent of demand while already running 2 hours of overtime every shift. The premium is paid and the area still falls short. Before it is a cost problem, it is an on-time-delivery problem.
02 · The diagnosis
The constraint today, and why it will move
Every production system has one operation or policy that governs its pace, the constraint, sometimes called the drum. Today it is Op 10, the one station running slower than demand requires while every station after it has pace to spare. The cart ahead confirms it, nearly two hundred parts deep and still building. Relieving Op 10 will not finish the work: the constraint moves, and the sequence below follows it.
Mapped end to end, the same story runs through the flow.
03 · The moves
Four moves, in the order the system requires
The moves themselves are practical. The difficult part is knowing their order. Each change alters the operating system, so the next move is chosen against the new constraint rather than the original one.
Quality work starts in parallel with the first recovery move. Root-cause investigation, corrective actions, and validation take longer than the scheduling and labor changes. Quality is shown fourth because its measurable result appears last, not because the work begins last.
1. Relieve the drum
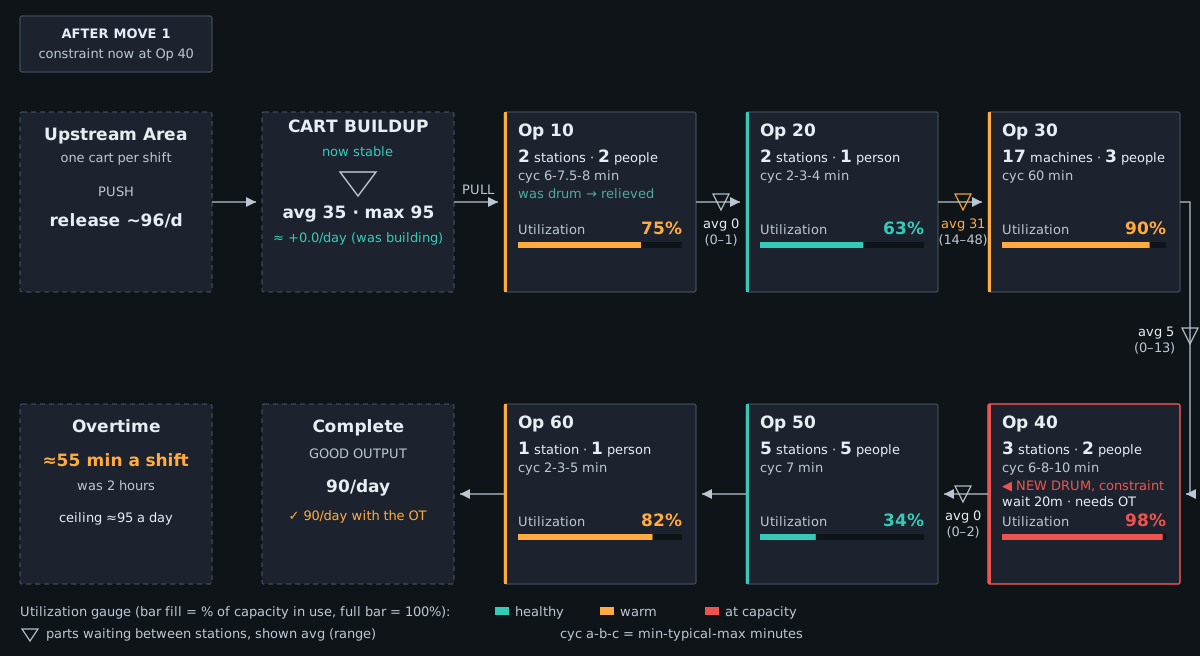
A processing-time study found Op 10 running each part longer than the qualified requirement. The shorter cycle was validated with operators and quality, then incorporated into standard work with no loss of quality. Overtime roughly halved, and the constraint moved to Op 40.
The same map, one move later. Watch the red border: it leaves Op 10, now at 75 percent with the cart stable behind it, and lands on Op 40.
2. Balance the line
One operator moved from Op 50, which has slack, to Op 40, the new drum. No new headcount. Overtime fell to about 30 minutes a shift, and the constraint moved to Op 30.
3. Stabilize flow through Op 30
A repeating release sequence matched to demand mix prevents one part type from overwhelming its dedicated machine pool. It does not increase theoretical capacity. It reduces queues, WIP, and lead time while making the remaining limit visible and controllable.
4. Root-cause the quality loss
Rework sends parts back through stations that are already busy, and scrap consumes parts along with the capacity that built them. Focused root-cause sprints start alongside move 1: defects are stratified, causes confirmed, and corrective actions validated on the floor. The analysis sets the target, 8 percent rework and 2 percent scrap against today's 15 and 5, and the sprints close the gap to it.
The constraint moves as the system improves
The value is not only finding the first bottleneck. It is predicting where the constraint will move next and sequencing the recovery correctly.
Where quality loss is a major constraint, a focused quality sprint can be scoped around defect stratification, root-cause analysis, corrective actions, validation, and control.
04 · The operating result
Demand met at straight time
With the same crew and no new production equipment, maximum deliverable output rises from about 80 to about 117 parts per day under the same two-hour overtime allowance. That is a 46 percent increase in operating ceiling. The immediate 90-a-day requirement is met at straight time, leaving headroom for variation and future growth.
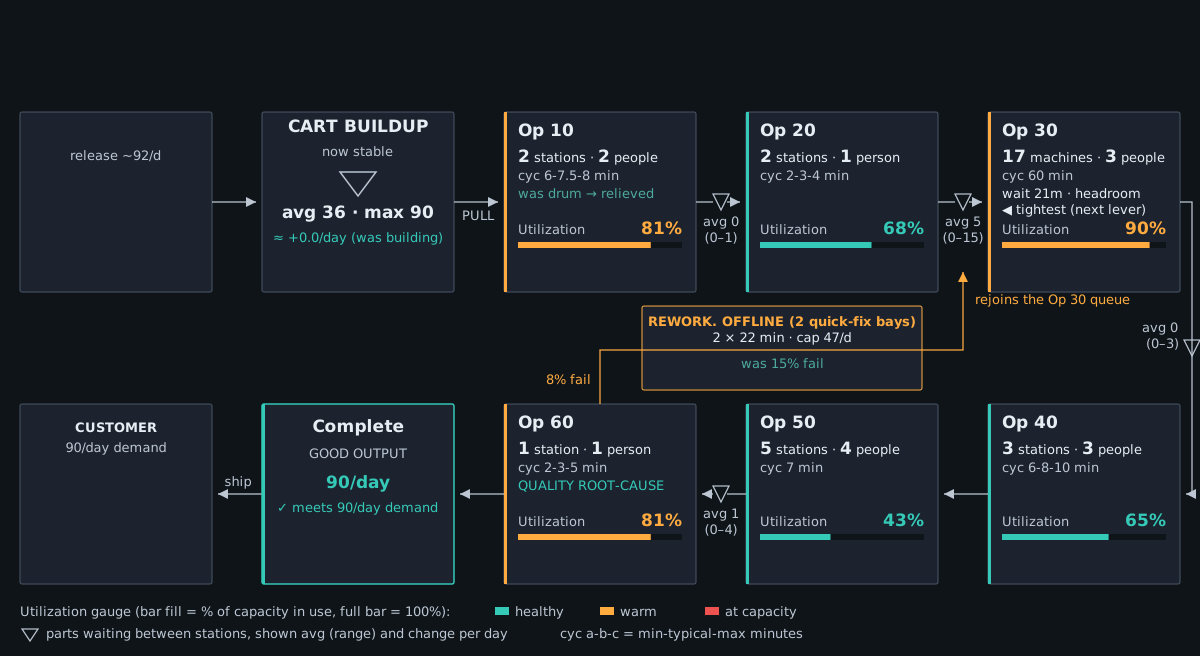
Move by move, the same recovery stacks up to the straight-time ceiling.
05 · The economic result
What the recovery is worth
The recoverable annual waste falls from about $1.4M to about $0.3M, subject to validation against a client's actual labor, material, quality, and inventory costs.
06 · The rate path
Rate-readiness, counted separately
When demand moves beyond what the recovered shift can hold, a lean second shift raises straight-time output to about 157 parts per day on the same production equipment. The design requires four net new hires, with two existing operators redeployed from capacity released by the recovery.
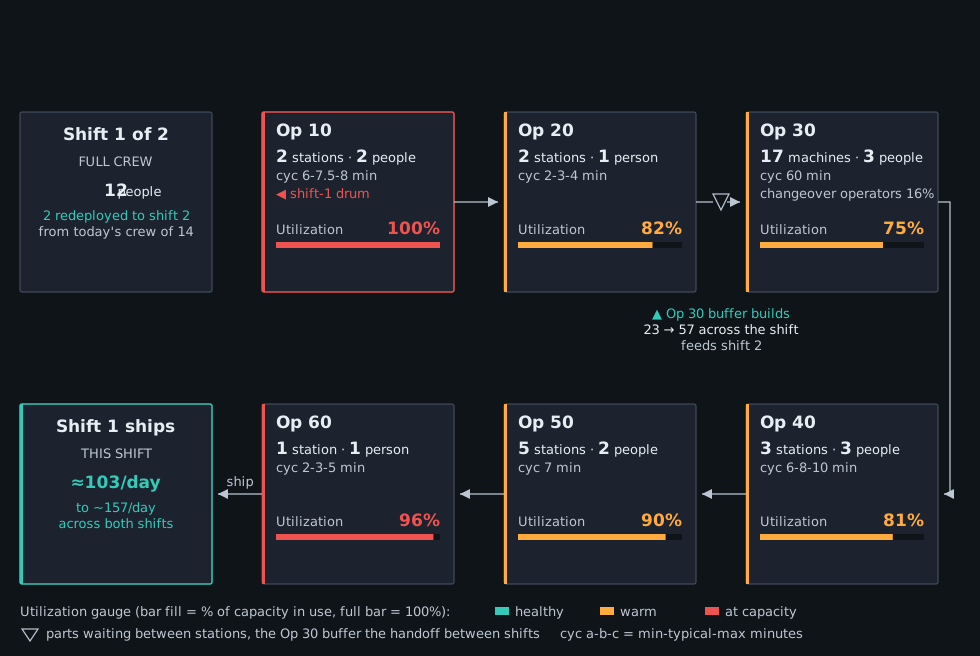
The second shift adds only labor on the same equipment, so it is counted separately and never summed into the recovery.
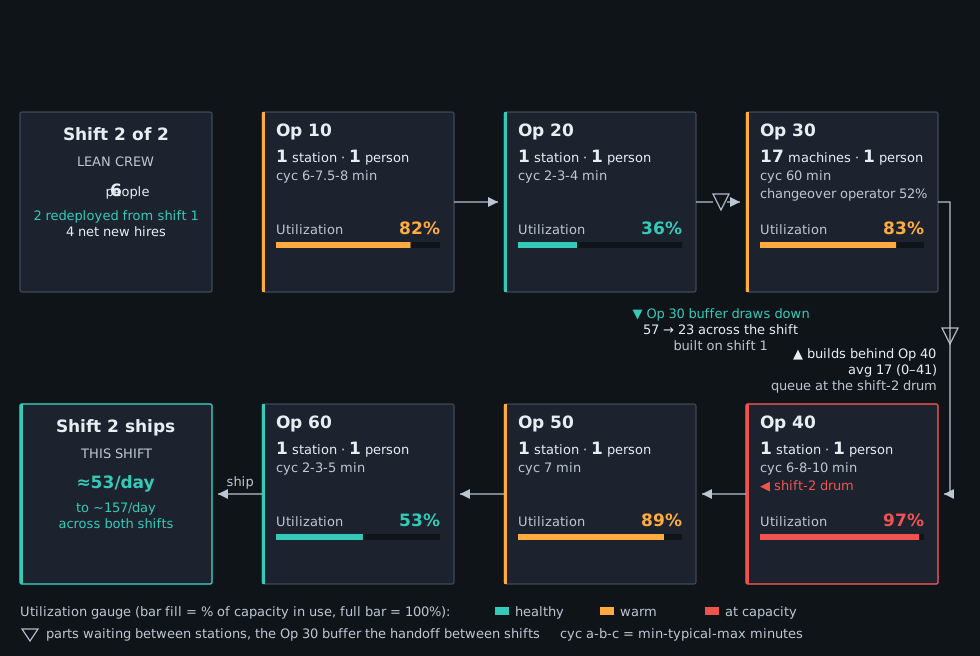
What each configuration holds as the build rate climbs, from the rate ramp analysis.
| Configuration | 90/day (today) | 110/day | 120/day | 150/day |
|---|---|---|---|---|
| Current state | ~80 ceiling | ~80 ceiling | ~80 ceiling | ~80 ceiling |
| Move 1, relieve the drum | ~55 min OT | ~95 ceiling | ~95 ceiling | ~95 ceiling |
| Move 2, balance the line | ~30 min OT | ~104 ceiling | ~104 ceiling | ~104 ceiling |
| Move 3, stabilize flow through Op 30 | ~30 min OT | ~104 ceiling | ~104 ceiling | ~104 ceiling |
| Move 4, root-cause the quality loss | no overtime | ~1.4 h OT | ~117 ceiling | ~117 ceiling |
| Rate step, two shifts | Not required | no overtime | no overtime | no overtime |
Overtime entries are what it takes to meet that rate. Ceiling entries are the most that configuration can ship even on full overtime.
07 · The method
How an engagement runs
- The study starts on the floor. Walking the line, talking with operators, and measuring cycle times, yields, staffing, and the shift pattern. The constraint is found here, not in software.
- The line is then modeled in discrete-event simulation from its own measured inputs, and the model is validated against the line's measured behavior before any conclusion is drawn.
- Improvement moves come from floor experience. Each one is tested in the model before anything changes on the floor, so the costly decisions are made on evidence.
- The model also shows where the constraint migrates after each move, so the full sequence is known in advance and the next bottleneck is never a surprise.
- Findings land as a costed, sequenced recommendation the client's team can execute, with the evidence behind every step.
Each engagement includes the data work required to make the operating picture reliable: extracting and combining production records, cleaning and validating inconsistent fields, transforming ERP and manually collected data, analyzing cycle time, throughput, and quality loss, and building the visualizations and simulation-ready inputs behind every figure in this study.
Floor observation shows where to look. Data analysis quantifies the loss. Simulation tests the decision.
08 · The proof
How the model is validated
A model is only worth what it can prove, so this one has to earn trust twice. First against the area. The model is built from the area's own measured cycle times, yields, staffing, and shift pattern, tuned to match one measure, throughput, and then required to reproduce WIP and lead time on its own, measures it was never tuned to.
Second against itself. An accounting check confirms every part released is either shipped, scrapped, or still in process, so the model neither creates nor loses work. Every figure in the study is the average of 30 replications with a 95 percent confidence interval. In an engagement the same validation runs against the client's measured line before any future-state move is tested.
09 · The ask
Recover the operation before adding capacity
The first answer is often not more equipment. The real limit may sit in handoffs, scheduling, labor allocation, release logic, quality loss, or the interaction between them. Recovering existing capacity first shows what the operation can hold and what genuinely needs to be added.
If your operation is meeting demand on overtime, falling behind with overtime not closing the gap, or facing a rate increase it may not hold, the locked-up capacity is likely already on your floor. I find it the same way it was found here.
This is the work a Plant Performance Assessment with a Simulation and Decision Study delivers, fixed fee and time-boxed, on your area.
Find it on your line